Business process property visualization scenarios
To learn how exactly attribute visualization facilitates business process communication, let's take a look at some example scenarios.
Highlighting activity execution KPIs
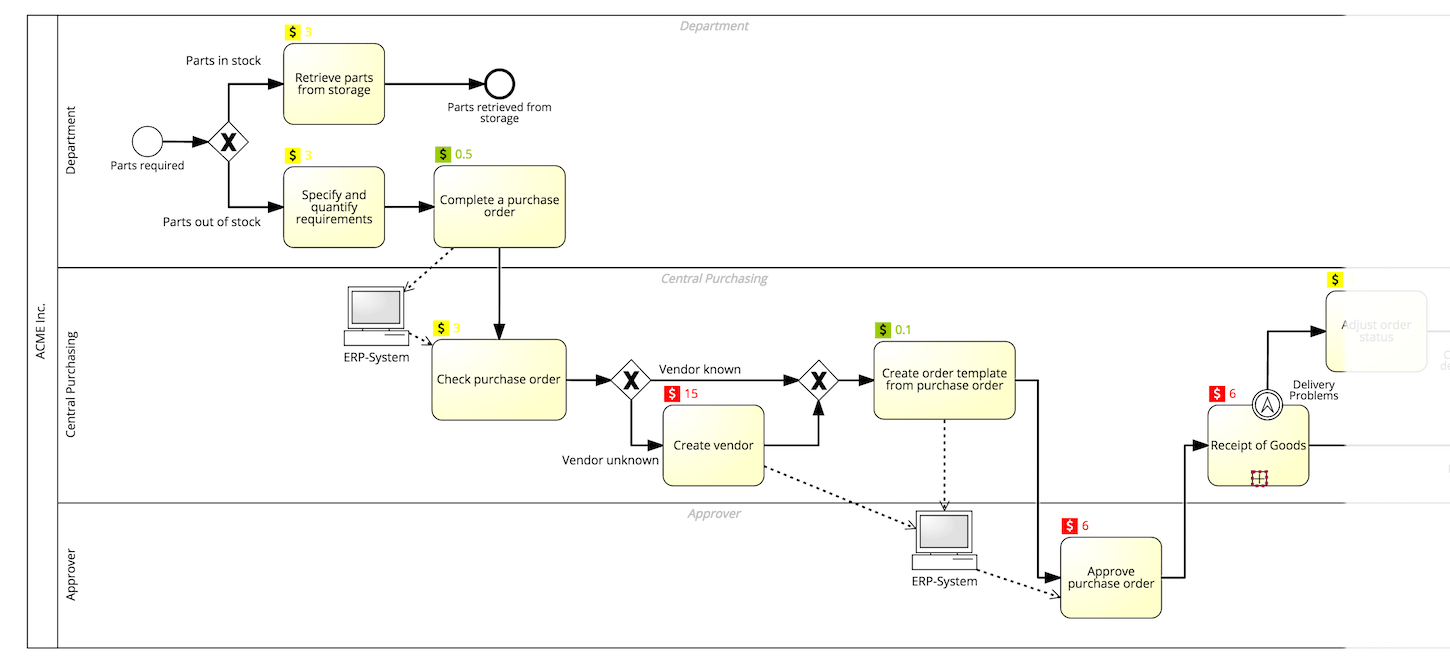
During a cost optimization meeting, a process model with visualized execution cost indicators helps immediately establish a focus. In the example below, you can clearly see that concentrating the optimization efforts on the activities highlighted in red is more likely to reduce costs.
Process-oriented risk management
Risk analysts review process models to ensure an organization complies with laws and regulations, but also to control the financial or even physical damage a business process can cause.
Associating risks with specific activities using a graphical representation of a process ensures process and risk definitions are in sync and highlights uncontrolled risks as process pain points.
Learn more about risk management in our blog post Hands-On Process-Oriented Risk Management.
A similar use case is highlighting undocumented activities during a refinement meeting between domain experts and business analysts.
Highlighting additional documentation for process participants
If a process is carried out by humans, visualized attributes can facilitate the correct process execution. In this simplified version of our error ticket prioritization process, the system highlights all activities that require the special attention of the responsible process participant (in this case a Support Engineer). Clicking on the corresponding activity reveals further information.
Configuring attribute visualization layers
In SAP Signavio Process Manager, you can configure attribute visualization layers that highlight process elements whose properties match specific rules. The rules are then dynamically applied to your diagrams.
You can activate the layers:
- in the graphical editor - during modeling sessions,
- in the Collaboration Hub- to present the single source of truth for process stakeholders, or
- for PDF print outs - for presentations and reports.
Conclusion - the benefits of visualizing business process properties
Visualizing key process model properties — especially KPIs — allows business analysts to identify key issues at a glance and helps process participants to focus their attention on the aspects that matter most. Configuring a set of rules that are automatically applied to your process diagrams form a convenient approach to enhance communication with little effort.
Get started with collaborative process design now and sign up for a free 30-day trial account.


